 Monitoring system metrics is an essential part of maintaining the health and performance of a server. With TICK Stack, it’s easy to monitor and visualize system metrics in real-time. In this guide, we will walk you through the steps to install and set up TICK Stack on CentOS 7 to monitor system metrics.
What is TICK Stack?
TICK Stack is a set of open-source tools used for monitoring and visualizing time-series data. The name stands for Telegraf, InfluxDB, Chronograf, and Kapacitor. Each tool serves a specific purpose in the monitoring and visualization process. Telegraf is used for data collection, InfluxDB for data storage, Chronograf for data visualization, and Kapacitor for alerting and anomaly detection.
Step 1: Install Telegraf
Telegraf is a data collector that collects data from various sources and sends it to InfluxDB for storage. To install Telegraf, follow these steps:
- Update the system packages by running the following command: sudo yum update -y
- Install the Telegraf package by running the following command: sudo yum install telegraf -y
- Once installed, start and enable the Telegraf service by running the following commands: sudo systemctl start telegraf sudo systemctl enable telegraf
Step 2: Install InfluxDB
InfluxDB is a time-series database that stores the data collected by Telegraf. To install InfluxDB, follow these steps:
- Add the InfluxDB repository to the system by running the following command: sudo tee /etc/yum.repos.d/influxdb.repo <<EOF [influxdb] name = InfluxDB Repository – RHEL $releasever baseurl = https://repos.influxdata.com/rhel/\$releasever/\$basearch/stable enabled = 1 gpgcheck = 1 gpgkey = https://repos.influxdata.com/influxdb.key EOF
- Install the InfluxDB package by running the following command: sudo yum install influxdb -y
- Once installed, start and enable the InfluxDB service by running the following commands: sudo systemctl start influxdb sudo systemctl enable influxdb
Step 3: Install Chronograf
Chronograf is a web-based user interface used for data visualization and exploration. To install Chronograf, follow these steps:
- Add the Chronograf repository to the system by running the following command: sudo tee /etc/yum.repos.d/chronograf.repo <<EOF [chronograf] name = InfluxData Chronograf Repository baseurl = https://repos.influxdata.com/chronograf/rpm enabled = 1 gpgcheck = 1 gpgkey = https://repos.influxdata.com/influxdb.key EOF
- Install the Chronograf package by running the following command: sudo yum install chronograf -y
- Once installed, start and enable the Chronograf service by running the following commands: sudo systemctl start chronograf sudo systemctl enable chronograf
Step 4: Install Kapacitor
Kapacitor is used for alerting and anomaly detection. To install Kapacitor, follow these steps:
- Add the Kapacitor repository to the system by running the following command: sudo tee /etc/yum.repos.d/kapacitor.repo <<EOF [kapacitor] name = InfluxData Kapacitor Repository baseurl = https://repos.influxdata.com/kapacitor/rpm enabled = 1 gpgcheck = 1 gpgkey = https://repos.influxdata.com/influxdb.key EOF
- Install the Kapacitor package by running the following command: sudo yum install kapacitor -y
- Once installed, start and enable the Kapacitor service by running the following commands: sudo systemctl start kapacitor sudo systemctl enable kapacitor
Step 5: Configure Telegraf
Telegraf comes with a default configuration file that collects metrics from various sources. However, you can customize the configuration file to suit your needs. To configure Telegraf, follow these steps:
- Open the Telegraf configuration file using a text editor: sudo vi /etc/telegraf/telegraf.conf
- Customize the configuration file to suit your needs. You can specify which metrics to collect, set up data tags, and more.
- Save and exit the file.
- Restart the Telegraf service to apply the changes: sudo systemctl restart telegraf
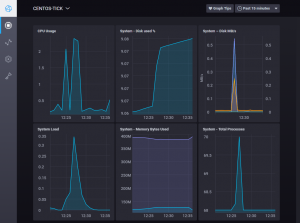
Step 6: Visualize Metrics with Chronograf
Chronograf provides a web-based interface for visualizing and exploring metrics collected by Telegraf and stored in InfluxDB. To access the Chronograf web interface, follow these steps:
- Open a web browser and navigate to http://<server_ip_address>:8888.
- In the Chronograf login page, enter the username and password for the Chronograf user.
- Once logged in, you can create dashboards, add data sources, and more.
Step 7: Set Up Kapacitor for Alerting
Kapacitor is used for alerting and anomaly detection. To set up Kapacitor for alerting, follow these steps:
- Open the Kapacitor configuration file using a text editor: sudo vi /etc/kapacitor/kapacitor.conf
- Customize the configuration file to specify which metrics to alert on, set up alerting rules, and more.
- Save and exit the file.
- Restart the Kapacitor service to apply the changes: sudo systemctl restart kapacitor
Monitoring system metrics is crucial for maintaining the health and performance of a server. With TICK Stack, you can easily collect, store, and visualize system metrics in real-time. By following the simple steps outlined in this guide, you can set up TICK Stack on CentOS 7 to monitor your system metrics and ensure your server is running smoothly.